rgb#
- colorsynth.rgb(spd, wavelength=None, axis=-1, spd_min=None, spd_max=None, spd_norm=None, wavelength_min=None, wavelength_max=None, wavelength_norm=None)[source]#
Convert a given spectral power distribution into a RGB array that can be plotted with matplotlib.
- Parameters:
spd (ndarray) – a spectral power distribution to be converted into a RGB array
wavelength (None | Quantity) – The wavelength array corresponding to the spectral power distribution. If
None, the wavelength is assumed to be evenly sampled across the human visible color range.axis (int) – the logical axis corresponding to changing wavelength, or the axis along which to integrate the spectral power distribution
spd_min (None | ndarray) – the value of the spectral power distribution representing minimum intensity.
spd_max (None | ndarray) – the value of the spectral power distribution representing minimum intensity.
spd_norm (None | Callable[[ndarray], ndarray]) – an optional function to transform the spectral power distribution values before mapping to RGB
wavelength_min (None | Quantity) – the wavelength value that is mapped to the minimum wavelength of the human visible color range, 380 nm.
wavelength_max (None | Quantity) – the wavelength value that is mapped to the maximum wavelength of the human visible color range, 700 nm
wavelength_norm (None | Callable[[Quantity], Quantity]) – an optional function to transform the wavelength values before they are mapped into the human visible color range.
Examples
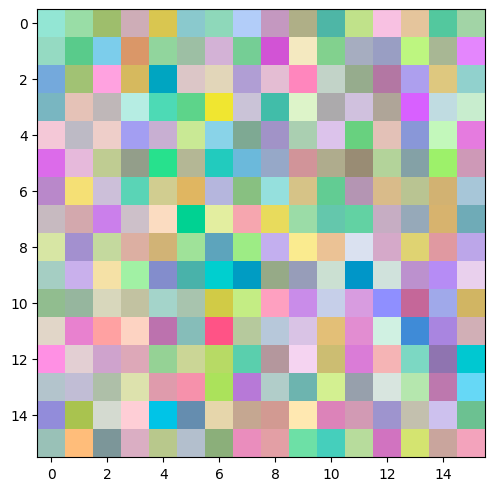
Colorize a random, 3D numpy array.
import numpy as np
import matplotlib.pyplot as plt
import colorsynth

# Create a uniform random 3D numpy array
a = np.random.uniform(low=0, high=1, size=(16, 16, 11))

# Colorize the 3D numpy array
rgb = colorsynth.rgb(a)

# Plot the resulting RGB image
fig, ax = plt.subplots(constrained_layout=True)
ax.imshow(rgb);